
Machine Learning (ML) (or Artificial Intelligence AI) is trending. Publications with regard to ML are on the increase in medical literature.
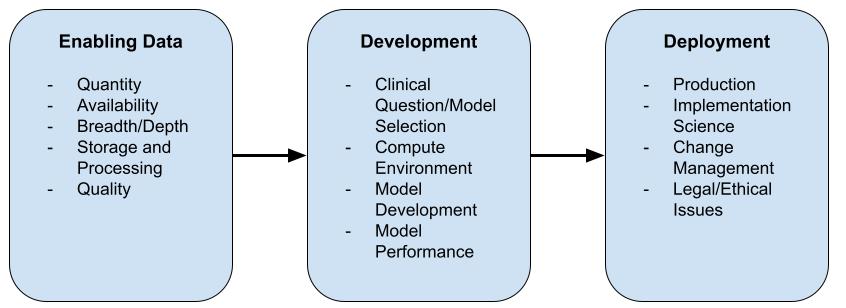
Specifically critical care medicine generates huge amounts of detailed data. In a recent article steps are described to enable use of ML in daily clinical practice. This blog will describes an actual working implementation of the first step in ML to be used in clinical practice.
Mamdani, M., & Slutsky, A. S. (2020). Artificial intelligence in intensive care medicine. Intensive Care Medicine, 47(2), 147–149. http://doi.org/10.1007/s00134-020-06203-2
Quantity
Machine learning demands data, lots of data. When talking about ML, you’ll quickly discuss what is coined as “Big Data”. Essentially, whenever data processing is transformed from paper based to electronically stored, “Big Data” is generated. At our Pediatric Intensive Care Unit (PICU), along with our other Hospital’s Neonatal Care Unit (NICU) and adult ICU, this started at:
 -- Query to select the first data row
 -- with patient data stored in PICURED

 SELECT TOP 1 d.pat_datetime FROM dbo.Data d
 ORDER BY d.pat_datetime

 -- Query to the total amount of records
 SELECT COUNT(*) FROM dbo.Data d
Yielding 2008-03-24 13:30:00.000 as the start date of data collection for our PICURED PICU Research Database. From that moment on we have all patient related data at a minute to minute basis to our disposal.
The subsequent query resulted at the time of writing in a staggering count of 100907433 records, i.e. more than 100 million records. So, there is quantity.
Availability
In order to apply ML to data, the data has to be in the right format.
In ML world you have Features and Labels. What these are is briefly explained in this StackOverflow answer.
The fact is, ML is closely related to some core concepts used in traditional epidemiology. Basically, epidemiology studies the Association between Exposure (and/or Confounders) and Outcome.
Translated to ML this corresponds with Features and Labels. Features are the quantitative equivalent of Exposure (or Confounders) and Labels can be mapped to Outcome.
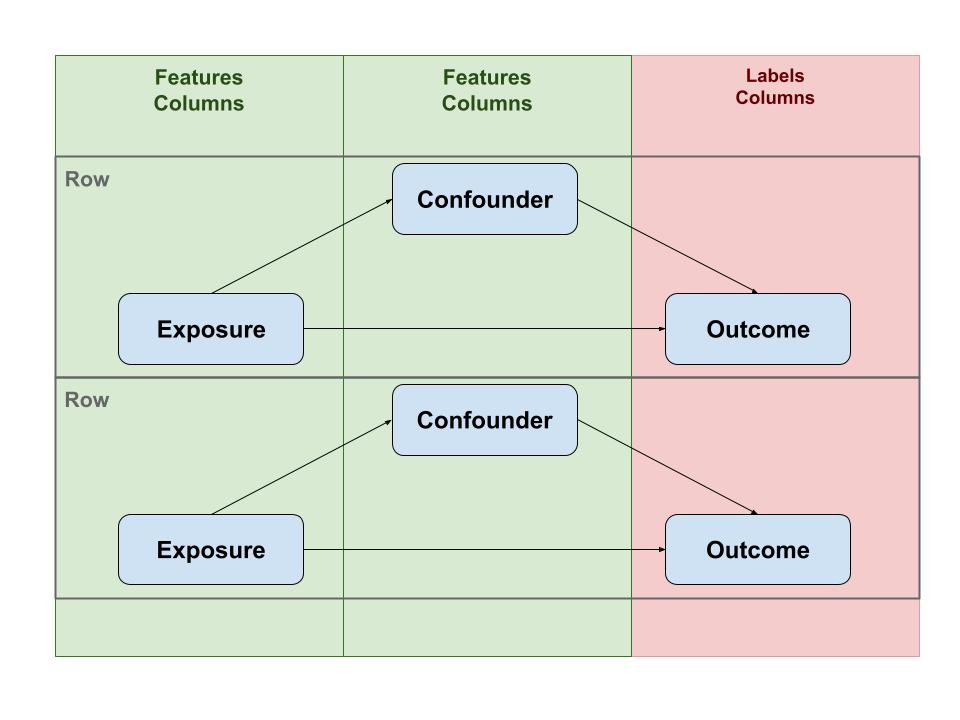
For ML to be able to compute a model, data has to be arranged in rows with the columns consisting of features and labels. So, essentially all data should be represented in a single (very large) table.
A Clinical hospital system or Patient Data Management systems (PDMS), does not store data in that format. A PDMS is designed to quickly write and read data for a single patient. In contrast, a data source for ML is essentially one big table containing all data for all patients.
Storage and Processing
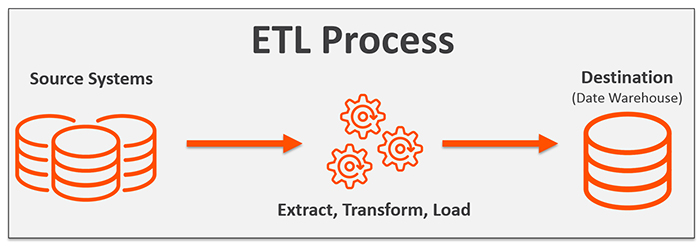
Thus, data from a PDMS has to be processed, transformed and then stored, this can also be described as Extract, Transform and Loading (ETL) of data from a PDMS database to a research database.
In the specific case of PICURED, there are 2 source systems:
- The MetaVision PDMS database and
- The Pedicatric Intensive Care Evaluation PICE
MetaVision is the PDMS in use in our Hospital on all intensive care units since 2008. PICE is a Dutch nationwide PICU registry in which data is collected to calculated mortality scores like PIM an PRISM and other features are collected like diagnoses. Taken together, our PDMS and PICE offer a rich source of data. However this data has to be transformed to columns in a single table. Therefore, a data model was created that looks like:
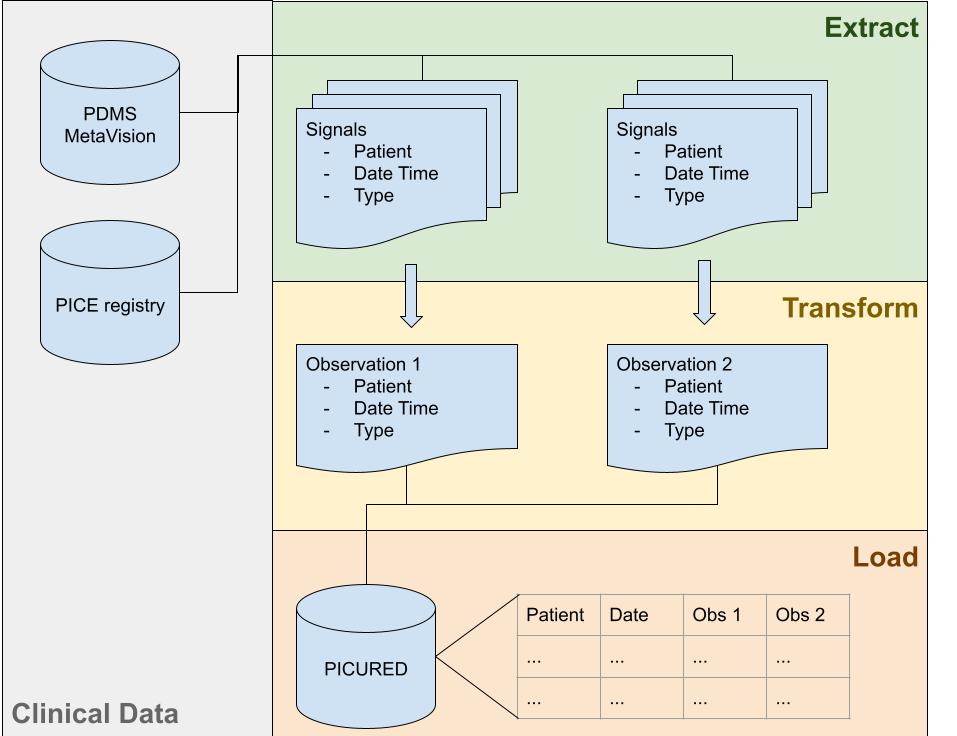
Raw data is modeled as Signals where each Signal is a single data point for a patient in time with a value.
type SignalId = int

type Value =
    | NoValue
    | Text of string
    | Numeric of float
    | DateTime of DateTime
type Signal =
    {
        Id: SignalId
        Name : string
        Value : Value
        PatientId : string
        DateTime : DateTime option
    }
These Signals are processed to Observations. An Observation is based on one ore more Sources, where a Source is converted Value. Sources are combined to a single Observation using a Collapse function.
type Observation =
     { Name : string
       Type : string
       Sources : Source list
       Collapse : Collapse }
and Source =
     { Id : SignalId
       Convert : Convert }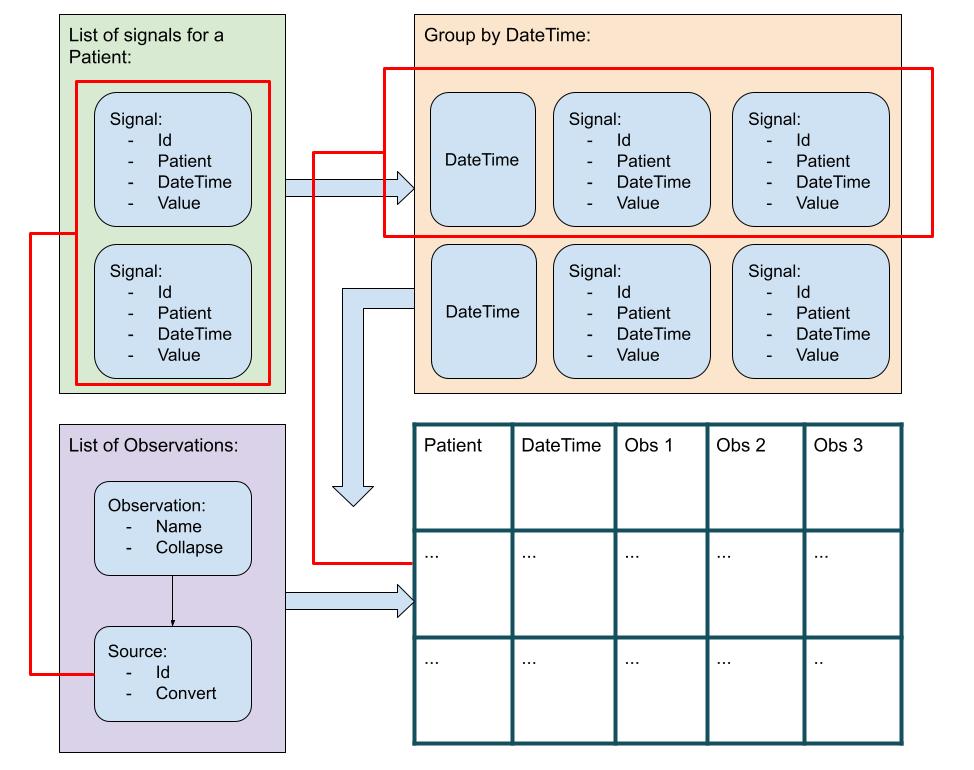
The general algorithm uses a list of patient Signals (i.e. raw data), that is grouped by date time. So, for each date time there is a list of Signals, that occurred at that date time. Each date time list is processed using a list of Observations, such that a data row is created, identified by patient and date time, with Observations as columns.
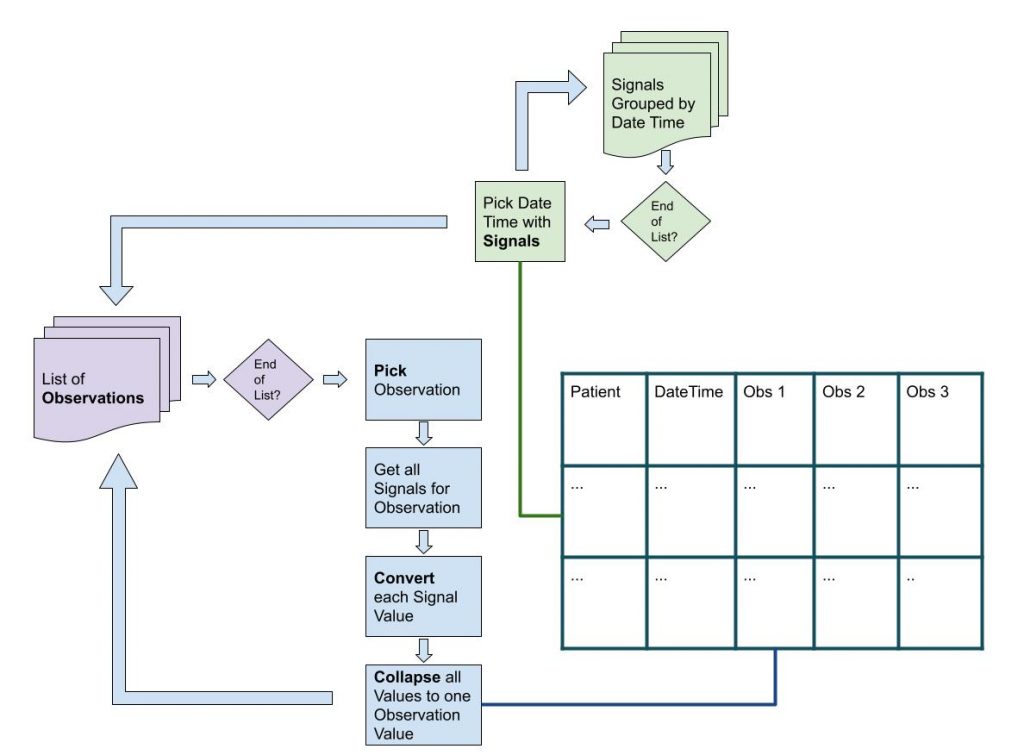
The algorithm loops through a list of Observations. For a single Observation the list of Signals is filtered looking for Signals that serve as Source for the Observation. The Convert function is used to convert the Signal Value. These converted Values are then collapsed (using the Collapse function) to a single Observation Value.
Finally, the end result is a DataSet, that looks like:
/// The resulting dataset with colums
/// and rows of data. Each row has a
/// unique hospital number, date time.
type DataSet =
    { Columns : Column list
      Data : (PatientId * DateTime * DataRow) list }
and Column =
    {
        Name: string
        Type: string
    }
and DataRow = Value list
A working prototype can be found in this gist. You can run the code in Repl.it.
Quality
The single most important problem in statistics, therefore also in Machine Learning, is the old adage: Garbage In, Garbage Out.
In the Signal processing algorithm, the Convert and Collapse functions can also be used to filter out non valid data.
type Convert = Signal -> Signal
let filter pred : Convert =
     fun signal ->
         let value =
             signal
             |> Signal.getNumericValue
             |> Option.bind (fun value ->
                 // check the boundaries
                 if value |> pred  then NoValue
                 else value |> Numeric
                 |> Some
             )
             |> Option.defaultValue NoValue
         { signal with Value = value }
let filterLow low : Convert =
     filter (fun value -> value < low)
let filterHigh high : Convert =
     filter (fun value -> value > high)
let filterLowHigh low high : Convert =
     (filterLow low) >> (filterHigh high)
Also, after processing can be applied by smoothing a time series.
The above graph shows actual patient data of mean arterial blood pressures. By applying a smoothing algorithm, outliers can be filtered out.
Conclusions
In this blog a real life working framework is described that enables production data to be analysed by machine learning. The framework is generic and can be used in a variety of settings for a variety of machine learning projects.